My Pick from the NBA Draft Data
2023-04-19

The Journey Until Now
In previous posts, I have talked about the data I obtained and sifted through about the annual NBA draft. With the goal of finding how well NBA teams can percieve talent, I webscraped it from the Basketball Reference site and cleaned it up so it would be easily usable. Then I got to the fun part: the analysis.
Having several variables to look at made it difficult to choose the most important and useful ones. I found that many players only play a small number of minutes in the league, so a simple way to gague the success of a player might be based on the amounts of minutes they have played. Another interesting finding was that shooting percentages didn’t seem to have any correlation. The final thing I discovered was that several advanced stats have a decent correlation with a player’s draft pick.
The Story
I decided to aggregate my data in a way that could be semi-useful to know as an observer. After looking at past years, I decided on a definition of what I would call an All-star. This definition is arbitrary, but it is a relatively low bar and should evaluate the player’s value and success in the NBA. Here are the acheivements a player must meet to be an All-star by this definition:
- Average a minimum of 15 points per game throughout their career
- Play an average of at least 30 minutes per game in their career
- Have a career Value over replacement (for a better explanation on this, see this page) of at least 10
From there, I made a graph to visualize the frequency an “All-star” was drafted at each pick, and this density graph was the result:
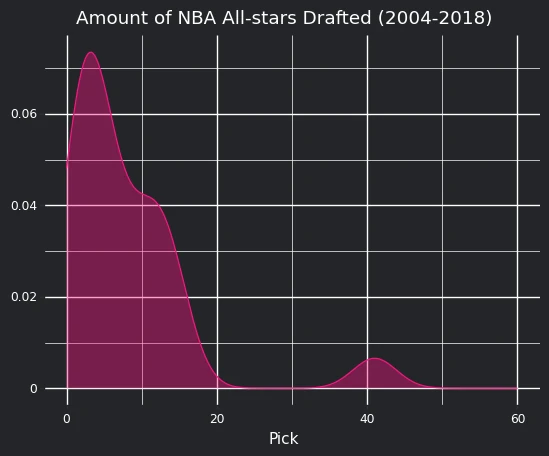
As we probably should expect, the vast majority of the most successful players are drafted early in the draft with a few outliers here and there. From what it seems, most of my “All-stars” are drafted somewhere between the first to the fifteenth pick, but after that, there is a very low chance that a player will be as successful. I do have to admit that this graph cannot tell the whole story; it only displays those players that had the qualities of what I defined as an All-star. It might be more useful to put this in perspective of what proportion of all players drafted at a pick will be that successful. With that in mind, I created this table:
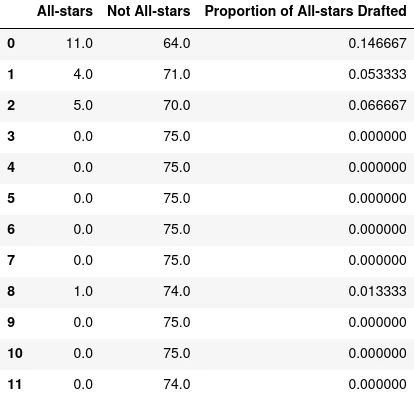
Having that perspective might also be useful for a team becuase it suggests that despite the best chances of getting a valuable player is in the beginning of a draft, the chances of getting an “All-star” is still not very high. Regardless, our intuition seems to be backed up by the fact that most of the highly-skilled players are selected near the beginning of the draft, suggesting teams do well at evaluating their talent before they have entered the NBA.
Thanks for following along with my journey of obtaining, cleaning, and analyzing this data. I hope you see what else is to come on this blog!