NBA Draft Exploratory Data Analysis
2023-03-31

NBA Draft Analysis
In my previous post, I talked about how I web-scraped data about basketball players in the NBA. The data has information about the NBA draft and some information about that player’s success in the league, and my goal with the data is to analyze how well NBA teams draft. I will look at the data and see whether there is any relationship between a higher pick number and various data points related to a player’s success. For now, I am just going to explore the data and see what is worth looking into
The Standard Stats: Points, Assists, and Rebounds
These are the most easily accessible data points that are easily measured. People have always used these to measure the skill-level of basketball players, but there are some problems with them. For example, a player can score many points, but if they shot and miss many shots to score those points, it is bad for the team. In general, they still do an okay job at measuring the ability of a player. For my case, I got each data point per game (points per game, etc.), which makes it somewhat reliant on how long they play in each game.
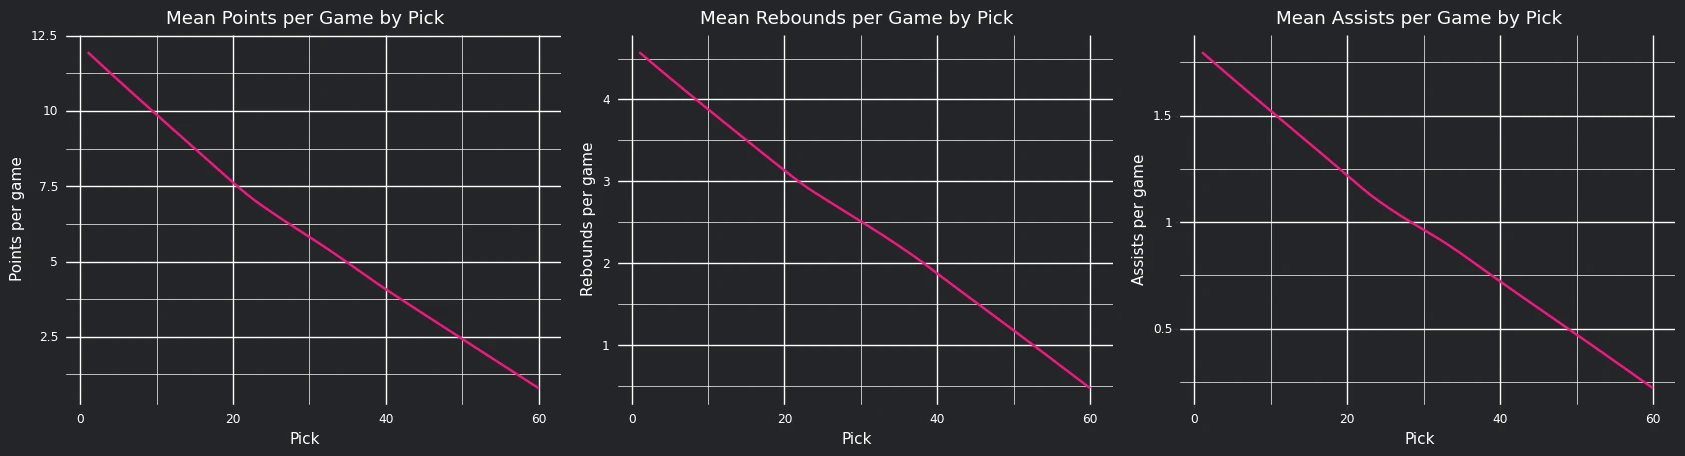
In this image, I simply made a line graph marking the mean points per game, assists per game, and rebounds per game based on the player’s pick. As we can see, there is generally a correlation bewteen the lower (earlier) pick number and higher each of these statistics. This makes a lot of sense because people who are picked first are generally going to score more, get more assists, and grab more rebounds.
Shooting Stats
One important factor in analyzing the ability of a player on the offensive end of basketball is how efficiently they can score; it is much better to make a high percentage of any shot regardless of whether they shoot one shot per game or 20 shots per game. The problem is that some shots are more valuable than others. Free throws are the easiest, but they are worth only 1 point. Then there are field goals (regular shots) that are worth 2, and three-pointers are the hardest and most valuable.
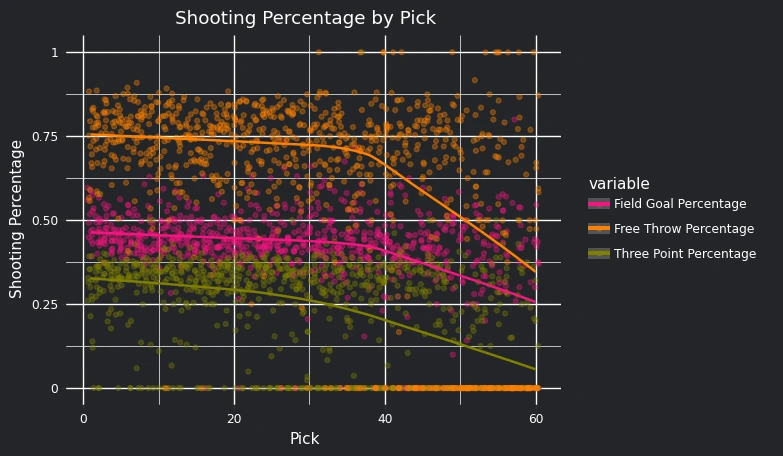
We see what we would expect from this: a general correlation between higher shot percentages and the earlier picks. However, we can see an odd occurance; there are many outliers that have made either 100% or 0% of various types of shots. This is likely caused by players who have only shot a few shots and either made or missed them. There are some important things we can do about that kind of problem.
Years, Games, and Minutes
We can look at the amount of years a player has played in the league, the number of games a player has played in, and the minutes of basketball a player has played in NBA games as good indicators of a player’s value. You can think of it like this: if a player is valuable, they will play more and stay in the league for a long time.
This can also be useful in the context of other stats. In thinking about the shooting statistics, we can choose a minimum number of years/games/minutes, and it will help us more accurately evaluate the value you would likely get out of a player in that range.
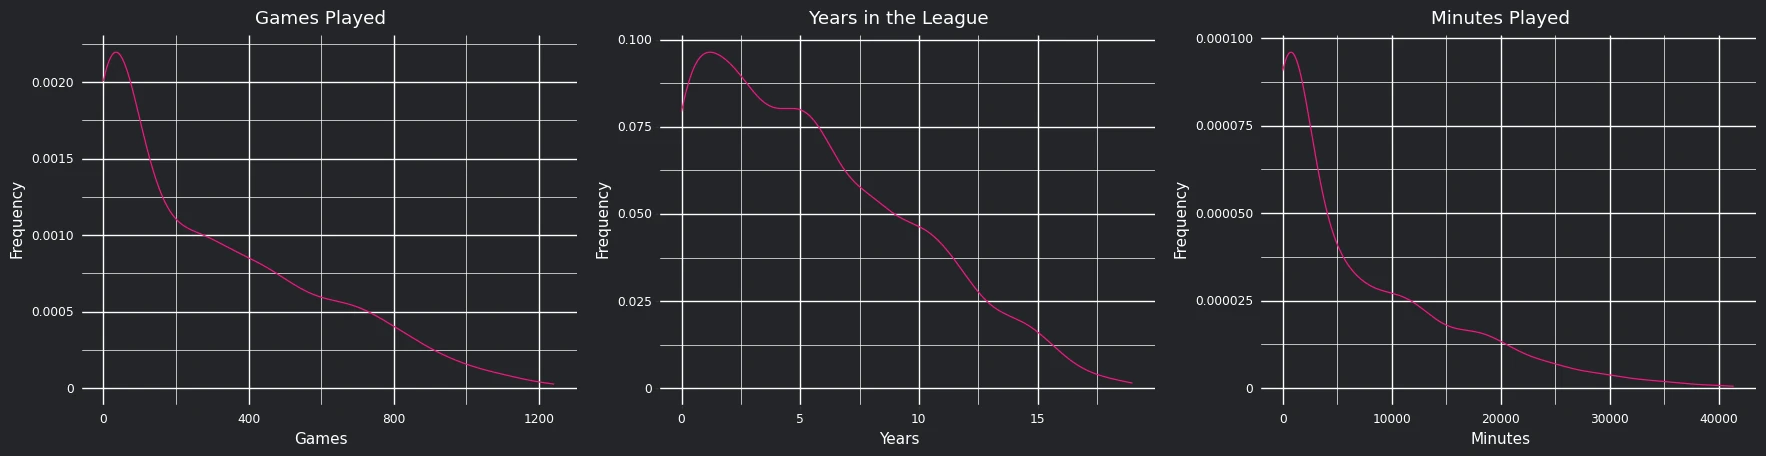
From these, it seems like it would make the most sense to limit based on the amount of minutes the player has played. If we set a minimum of 5000 minutes, we would limit a large portion of players who didn’t last long in the league. This also logically makes sense to use for a filter: a player can stay in the league for years and play in 100s of games, but they can still only play for a few minutes in total.
Returning to Shooting Stats
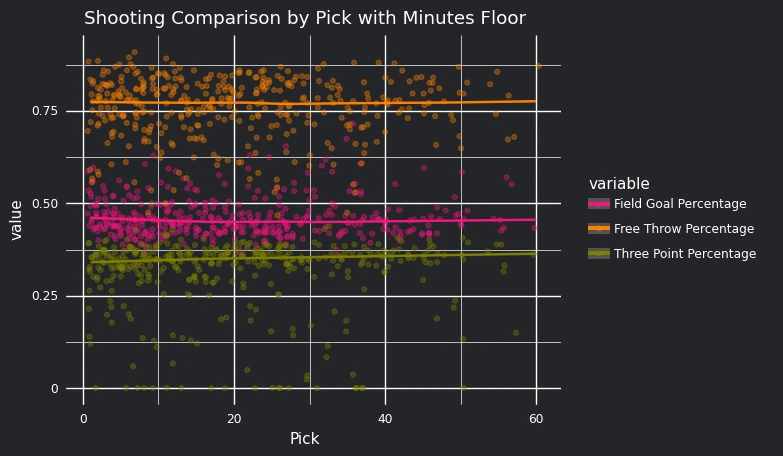
After applying the minimum number of minutes, there was a large shift in the correlation. Now the mean stays constant across all pick numbers, and even seems to have a slight positive correlation in the case of three point percentage. This can give us an interesting hypothesis: it doesn’t matter what pick a player is drafted at, they all basically have the same shooting ability. It kind of makes sense because if the level of competition is so high, the differences should be negligible for many things. At the very least, I think it is safe to conclude that shooting percentages are likely not so useful for my purposes.
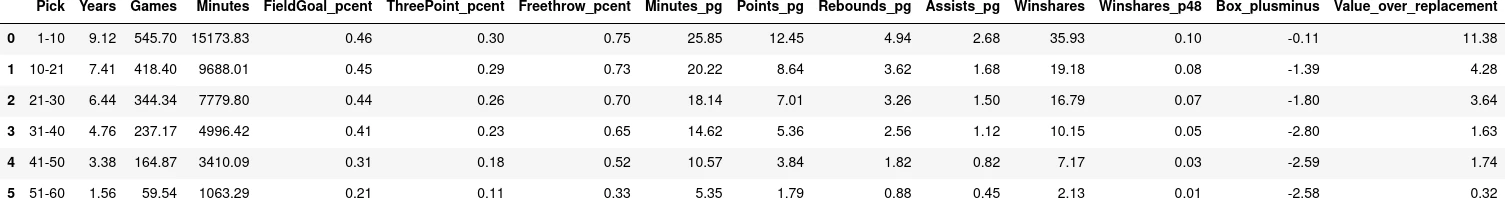
Advanced Stats
There are a few more variables that I would like to look at, those being winshares per 48 minutes, box plus minus, and value over replacement. These are some of the most important advanced stats of basketball. They are obtained through various methods of adding together other statistics or comparing to the league average. It is a difficult topic to explain sussinctly, but understand that they are complicated yet do a good job at evaluating a player’s value. Here is a quick summary of what each attempts to do:
- Winshare per 48 minutes: estimates the amount of wins contributed to by a player every 48 minutes
- Box plus minus: estimates a player’s contribution to the team while the player is in the game, controlled for the player’s position and the team’s overall success
- Value over replacement: using box plus minus, this estimates the difference in value between the player and a theoretical replacement player in the league
Here are also some links to a better explanation of how these are calculated:
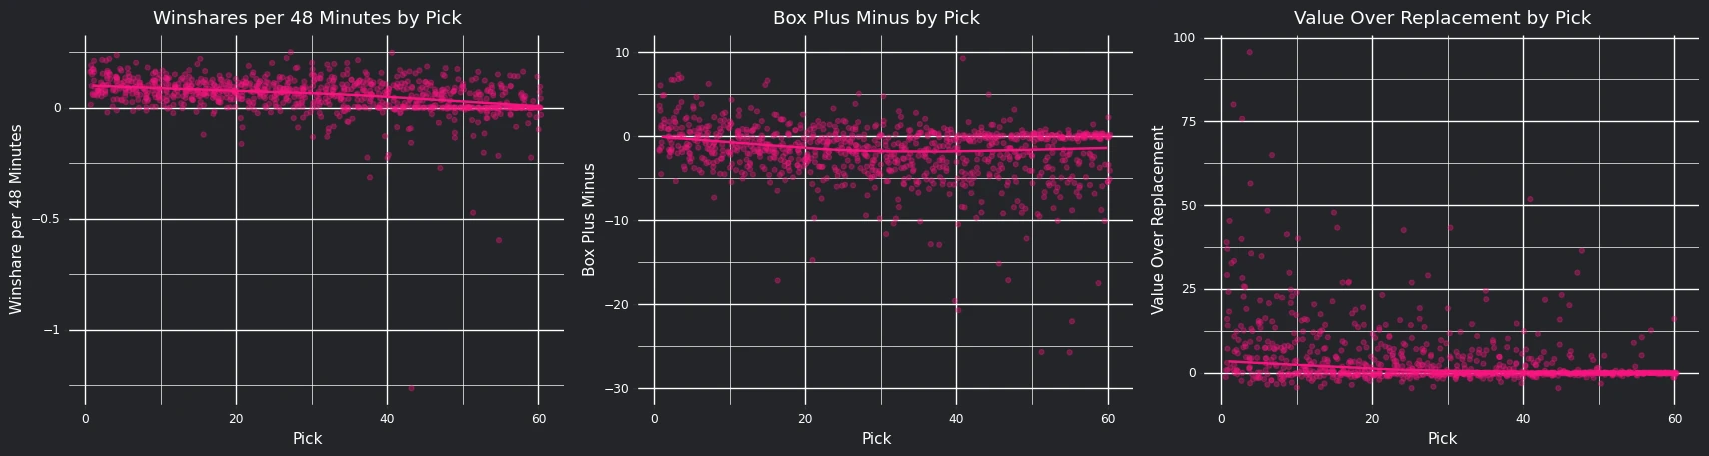
In those scatter plots, I chose to also put a line roughly displaying the mean, at each pick. While there are some extreme outliers on either end, we can see some general trends. For each of these variables, there seems to be a correlation between earlier picks and more positive values.
In Conclusion
I think there are some new, interesting things for me to analyze in this data, and there are some things that seem to be not as valuable as I previously thought. I really would like to look into some of the basic player variables (years, games, minutes) and some of the advanced stats (winshares per 48 minutes, box plus minus, and value over replacement). From this data, we can see some evidence that there might be a significant relationship between some of these variables and the pick a player is drafted at, and that might mean there is a real, important difference between a player drafted at the first pick versus the 30th pick.
In my next post, I will make a full analysis of this data, so come to check it out when it is up!